

Where it lives
Dashboards sits under Track, at Dashboards.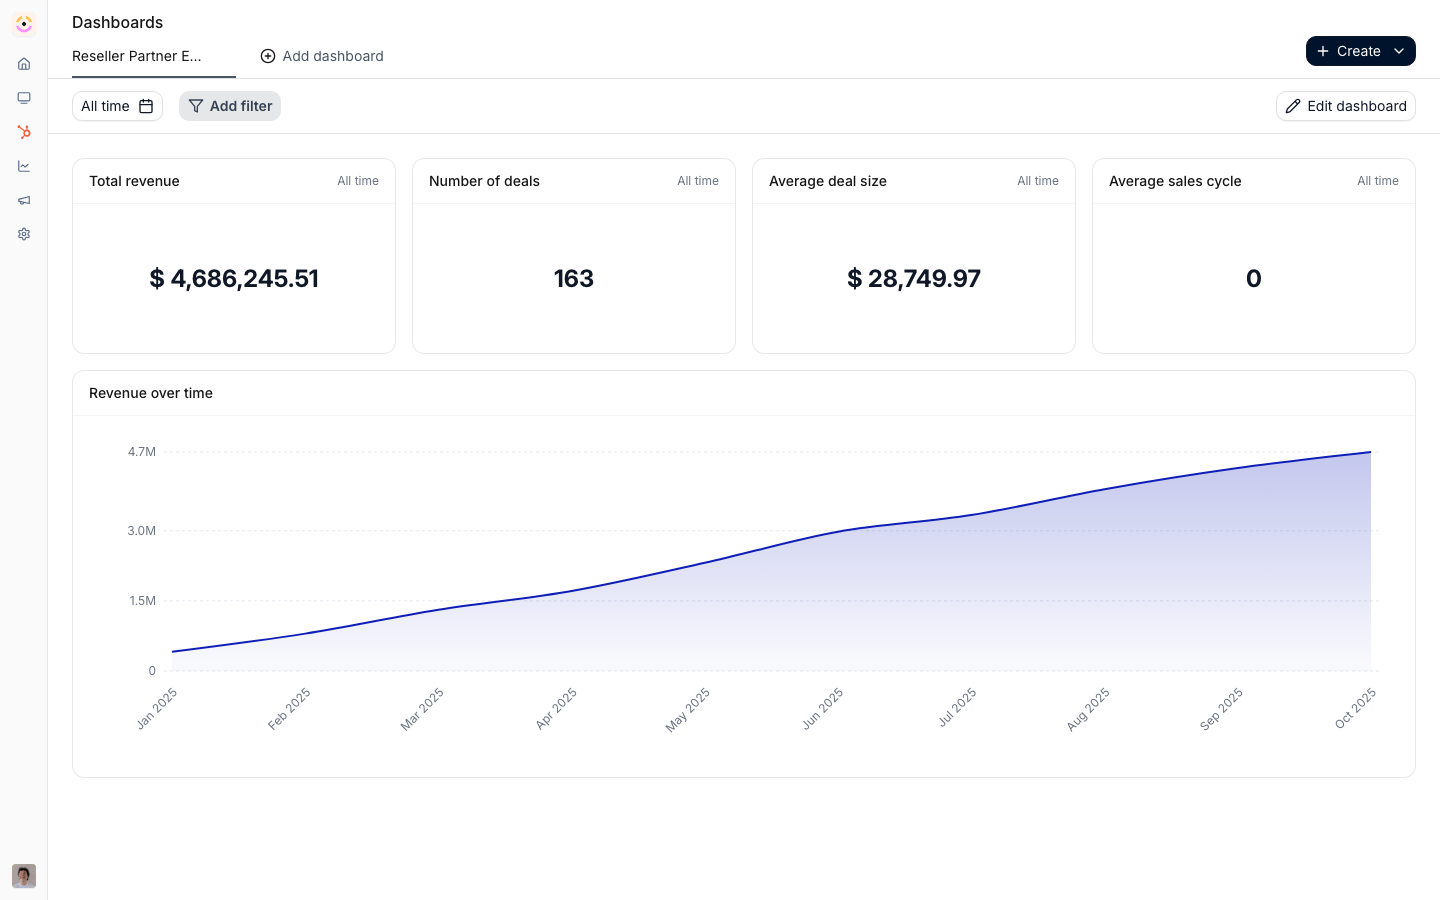
Before you start
How it works
Dashboards live under Track on the Dashboards page. A dashboard is a grid of saved reports you arrange by drag and drop, with multiple dashboards available as tabs. Each dashboard has audience filters and a date-range preset that apply across all its reports. The home page is separate: it shows a program overview built from a pipeline you select and a session date range, with widgets for new partners, portal visits, top assets, top revenue partners, and highlights. Any dashboard can be embedded in a partner portal through the Experience builder.Settings & configuration
Dashboards are managed at Dashboards.Dashboard tabs
Create multiple dashboards as tabs to organize different views.Report grid
Drag saved reports onto the grid and arrange their size and position.Audience and dates
Set audience filters and a date-range preset that apply to the whole dashboard.Manage dashboards
Rename, duplicate, or delete dashboards from their tabs as your views evolve.Home pipeline
On the home page, choose the deal pipeline used for the program overview; the choice persists. The date range is session-local.Portal embed
Use the Experience builder’s Dashboard embed to surface a dashboard to partners.How-to guides
Troubleshooting
A report will not add
A report will not add
Confirm the report is saved and you have access to it.
The home overview is empty
The home overview is empty
Select a pipeline and confirm the CRM is connected.
A partner sees nothing in an embed
A partner sees nothing in an embed
The dashboard’s data is scoped away by partner access.