

Where it lives
Partner Analytics sits under Partners, at Partners.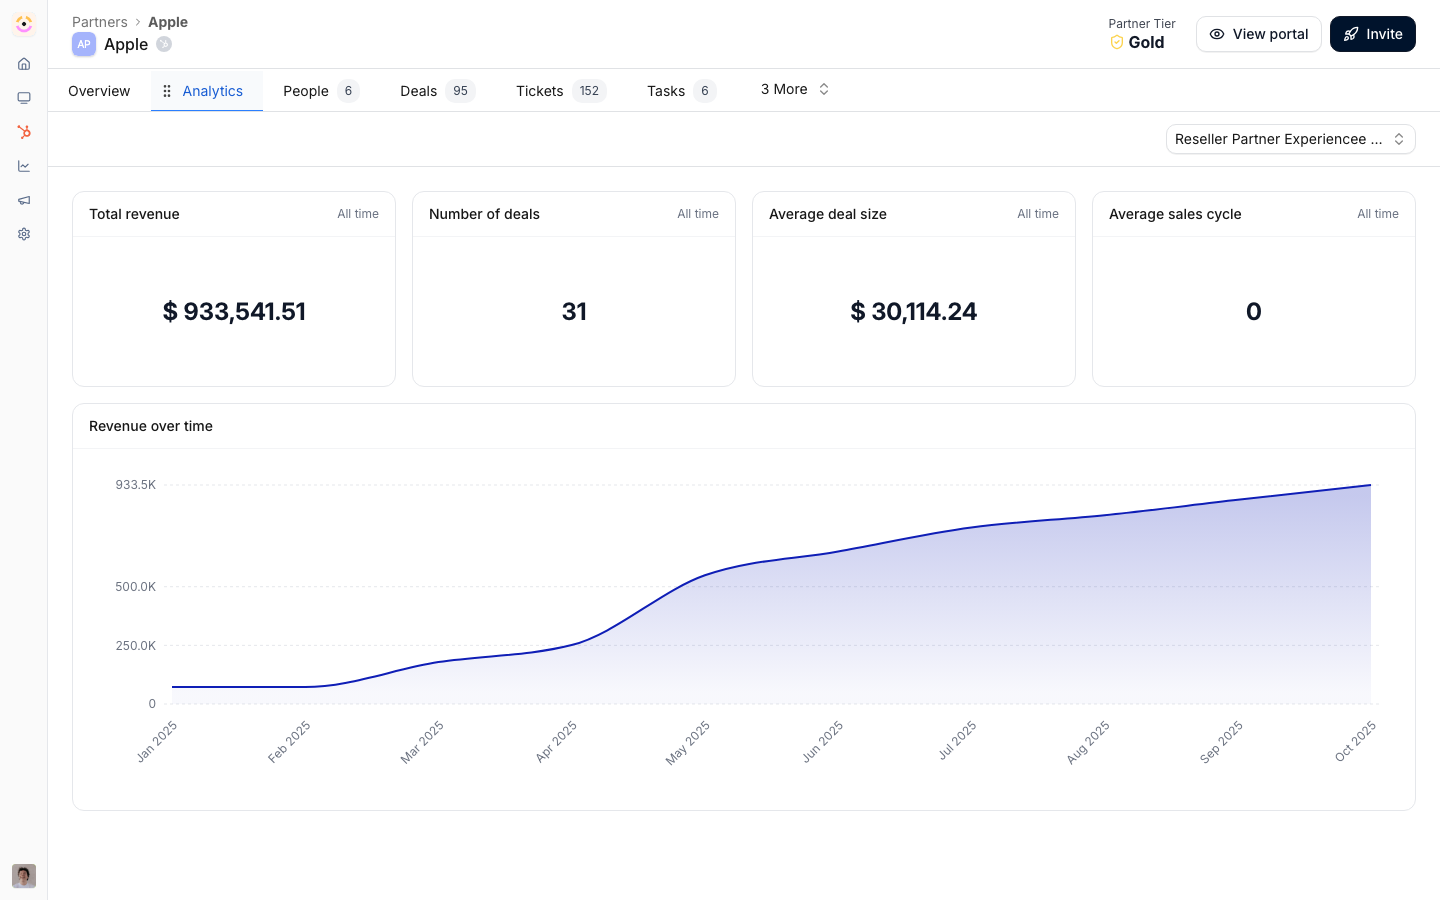
Before you start
How it works
Partner analytics appears in two places. On a partner’s detail page, the Overview tab shows revenue, engagement, top deals, and goals, and the Analytics tab embeds a dashboard scoped to that partner. Deal metrics are filtered by pipeline and attribution and locked to the partner. In the portal, you surface partner-facing analytics through portal sections: a Dashboard section (the collaboration dashboard) shows total revenue, deal count, average deal size, sales cycle, and a revenue-over-time chart; you can also add a Dashboard embed, a Report embed, or Goals. All partner-facing views are scoped to the viewing partner.Settings & configuration
Operator analytics are on the partner detail page from Partners.Partner overview
Open a partner to see revenue, engagement, top deals, and goal progress on the Overview tab.Partner analytics tab
The Analytics tab shows a dashboard scoped to the partner.Collaboration dashboard section
In the Experience builder, add a Dashboard section to an experience to show deal metrics for the partner.Dashboard and report embeds
Add a Dashboard embed or Report embed to a portal experience to surface org-built views, scoped to the partner.How-to guides
Troubleshooting
A partner's revenue is missing
A partner's revenue is missing
Confirm deals are attributed and the pipeline is selected.
Engagement looks empty
Engagement looks empty
The partner may have no recorded activity in the period.
A portal section shows nothing
A portal section shows nothing
The partner has no data in scope for that view.