

For partner ops and RevOps who keep a number on the partner account and want it reported across the whole ecosystem.Most programs already roll a number up onto the partner account in the CRM: total ARR, sourced revenue, headcount, certified engineers, a health or capacity score. Until now the Partners data source could only count partners, so that number was readable one record at a time and never as a total. Now you can aggregate it: sum or average any numeric or currency field on the partner’s own CRM record, split it by region, tier, phase, experience, or partner manager, and put the result on a dashboard or in the partner portal.
What you’ll achieve
A saved report whose metric is a field on the partner account, aggregated across every partner you have access to and broken down by the dimension you care about, ready for a dashboard or a portal embed.Before you start
1
Confirm reporting is on your plan
Reporting is a plan feature, and plans cap how many saved reports and dashboards you get. If you hit the cap or see an upgrade prompt, check what your plan includes at introw.io/pricing.
2
Put the number on the partner account
The metric has to exist as a numeric or currency property on the CRM object your partners are mapped to (the company, account, or your custom partner object). Roll it up there however you already do it, with a CRM calculated property, a rollup, a workflow, or an Introw workflow writing back.
3
Confirm the partner mapping
Partners must be mapped to that CRM object, so Introw reads the field off the right record. See Sync partners and contacts.
4
Check the breakdown field is usable
Grouping by region, segment, or industry uses a property on the same partner record. Introw dimensions such as tier, phase, experience, and partner team roles need no CRM property at all.
Steps
1
Create a report on the Partners source
Go to Reports, create a report, and set the Data source to Partners. The report now has one row per partner rather than one per deal, which is what makes an account-level field aggregate cleanly.
2
Set the metric to the account field
Open the Metric section (Y-axis on a bar or line chart) and choose Sum or Average, then pick the field in Of. The picker lists the numeric and currency properties of the partner’s CRM record, so “Total ARR” or “Certified engineers” appears next to your CRM’s logo.Leave the aggregation on Count if you want a partner count instead. Count ignores the metric field entirely.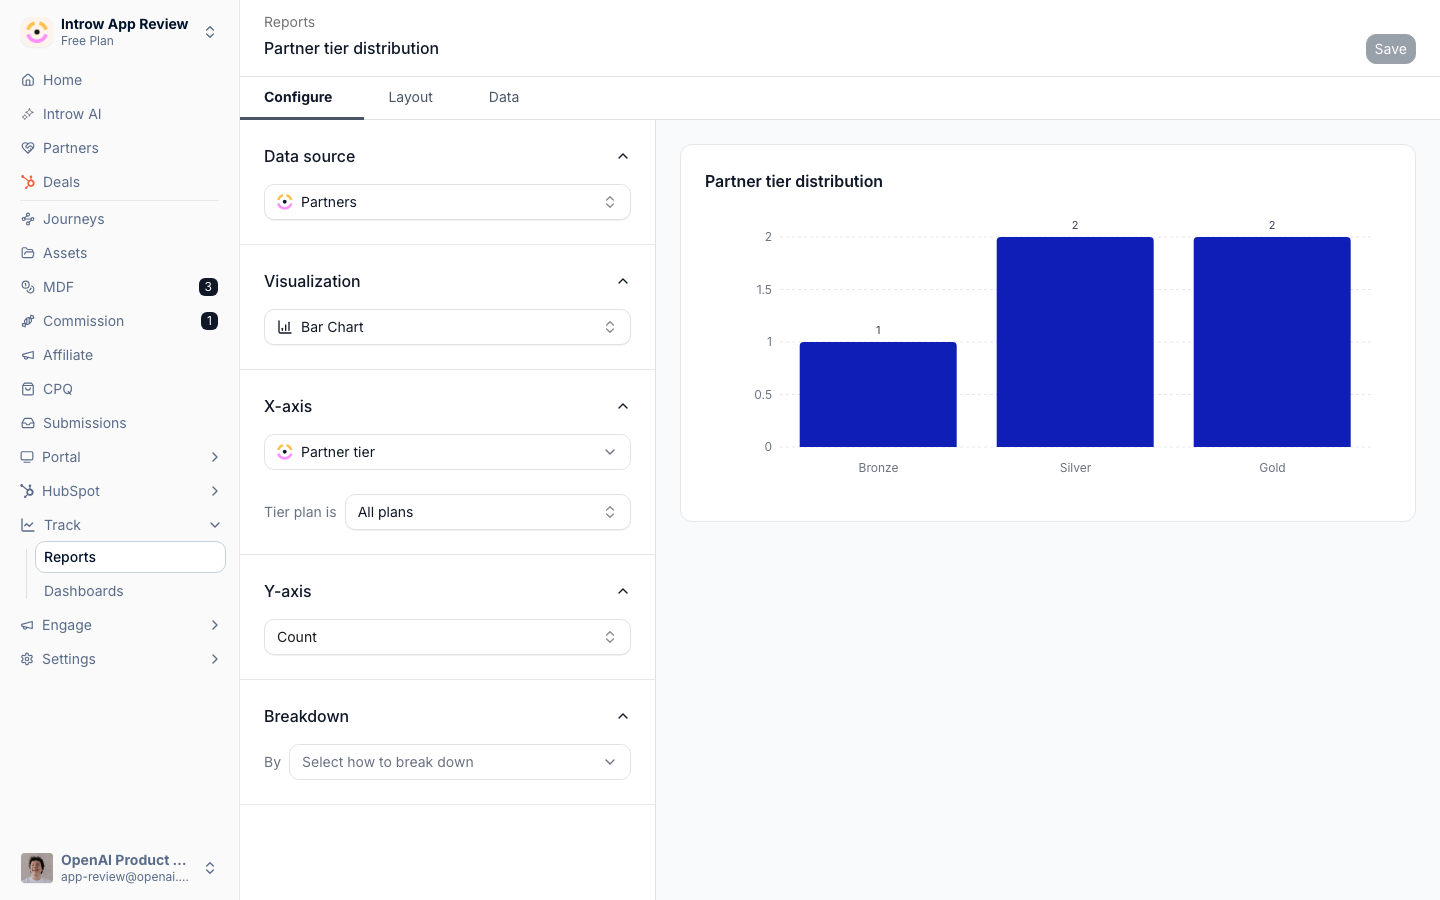
3
Break it down
Set the X-axis (or Breakdown on a pie chart) to the dimension you want to compare across:
- Tier, Phase, or Experience - Introw’s own partner dimensions.
- Partner team role - one option per role, so you get ARR per partner manager, per solution architect, or per whichever role owns the number.
- Any CRM property on the partner record - region, country, segment, industry, partner type.
- Time - to trend the total by the period partners were created in.
4
Filter to the partners that should count
On the Data tab, use Audience filters to limit the report to a set of partners, and Data filters to narrow on partner properties. A scoped role only ever sees its own partners, with no per-report filter to maintain.
5
Save it, then put it where people look
Save the report, then add it to a dashboard for your team, or embed it in the partner portal so partners see their own figure. Audience filters keep a partner’s view to their own data.
Verify it worked
The preview shows one bar, slice, or line per group with a currency or number format that matches the field, and a Number visualization of the same report equals the total you get by summing the property in your CRM. Switch the aggregation to Count and the chart should fall back to partner counts, which is a quick way to confirm you picked the field you meant.Limits & gotchas
Related
Build a report
The full builder, end to end.
Embed a dashboard in the portal
Show the figure to partners.
Partner analytics
The per-partner view of the same data.
Implementation reference
Full configuration options.