

What you’ll achieve
A clear read on how an asset is performing: total views, a trend over your chosen date range, and a breakdown of which people and partners viewed it and when. That is enough to decide what to promote, what to refresh, and what to drop.Before you start
1
Confirm there is activity
Engagement appears once the asset has been shared or embedded and viewed. If it is brand new, share it first so views can accrue. See Share an asset with a link.
Watch it
- Video
- Click through
Steps
1
Open the Engagement tab
Go to Assets, open an asset, and select its Engagement tab.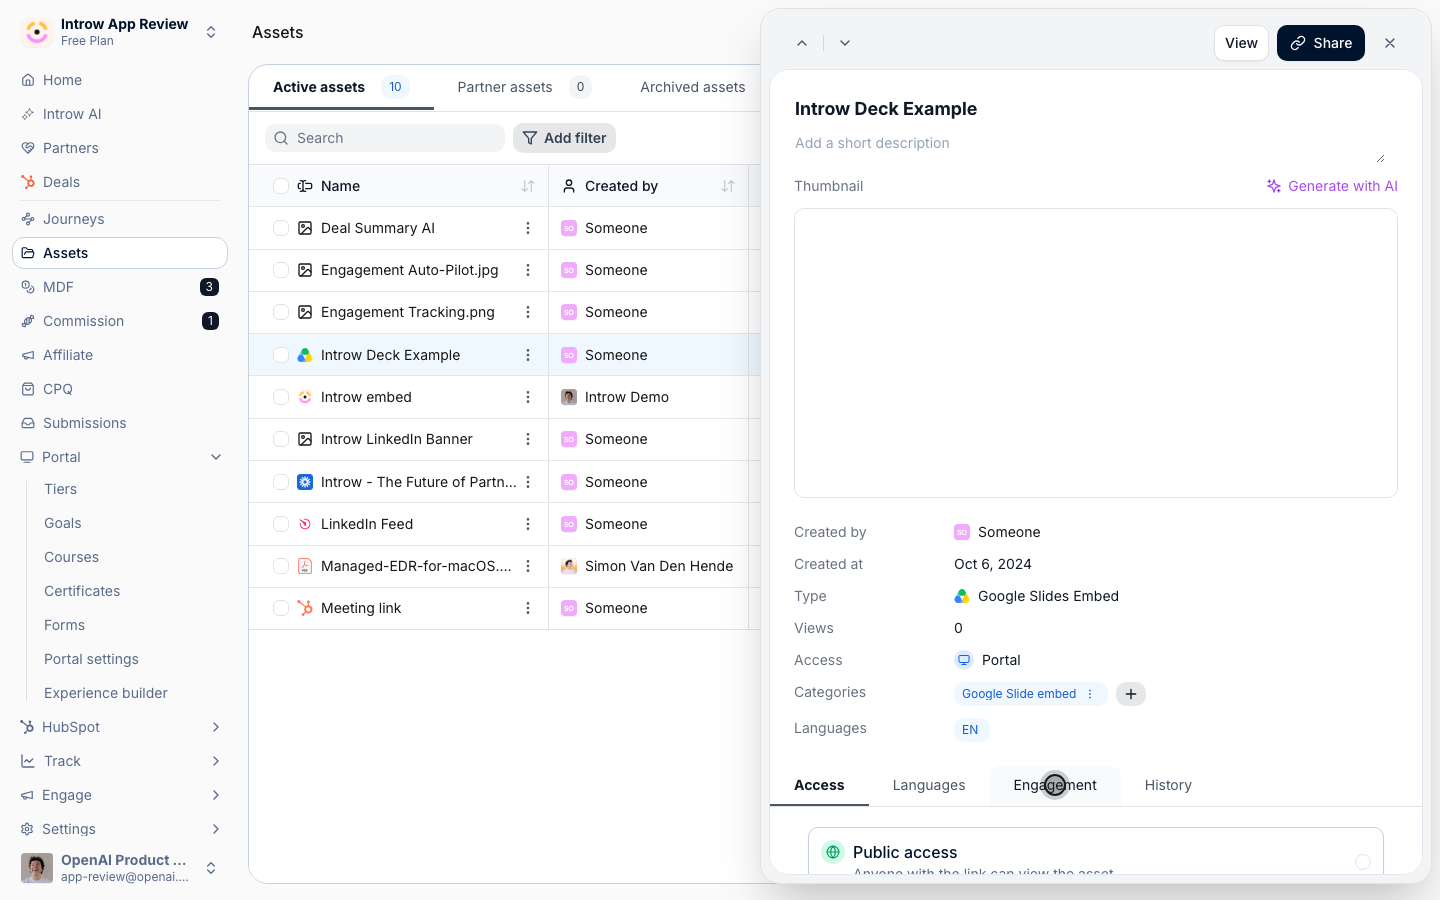
2
Set the date range
Use the date range picker to scope the view to the period you care about. Pick a preset for a quick window, or set a custom range to line engagement up with a campaign or quarter. The trend and breakdowns below update to match.
3
Read the views-over-time trend
Review the views-over-time chart to see whether interest is rising, flat, or fading across the selected range. A spike after a send or launch tells you the content landed; a flat line on important collateral is a signal to promote or refresh it.
4
Break down by people and partners
Switch between the two breakdowns to see who is engaging:
- People - individual viewers, with their last viewed date and total views. Use it to spot the specific champions engaging with the asset.
- Partners - engagement grouped by partner organisation, with last viewed and total views. Use it to see which partner accounts are actually using the content versus ignoring it.
Verify it worked
You can see total views, a trend across your chosen range, and per-person and per-partner engagement for the asset. That view is your evidence for which content to invest in and which to retire.Related
Share an asset with a link
Drive more tracked views to an asset.
Add an Asset Hub
Surface assets in the portal to grow engagement.
Implementation reference
Full asset library configuration options.