

What you’ll achieve
One saved report that compares your campaign kits by how often partners view and download them. A ranking of the people at your partners who used the kit, and a split by region or tier. Per-asset engagement, so you know which piece of a kit carries it.Before you start
1
Publish at least one kit
Usage only appears once partners can open the kit.
See Enable partners with a campaign kit.
2
Confirm reports access
You need reports write access, and report quota on your plan.
Watch it
- Video
- Click through
Steps
Tag each kit
1
Give every asset in the kit the campaign's category
Go to Assets and open the kit’s folder.
Select every asset in it and use the bulk editor to set Categories, or open each asset and add the category under Categories in its details panel.
- Name the category after the campaign, for example “Q4 2026 HubSpot campaign”.
- Use exactly one campaign category per kit. The report groups on it, so an asset in two campaign categories counts in both.
- Tag new assets as you add them to the kit, or they will be missing from the totals.
Build the usage report
1
Create a report on the Assets data source
Go to Reports, create a report and name it, for example “Campaign kit usage”.
On the Configure tab, set Data source to Assets.
Every view and download of an asset in the portal becomes one row, so the chart starts with one bar per asset.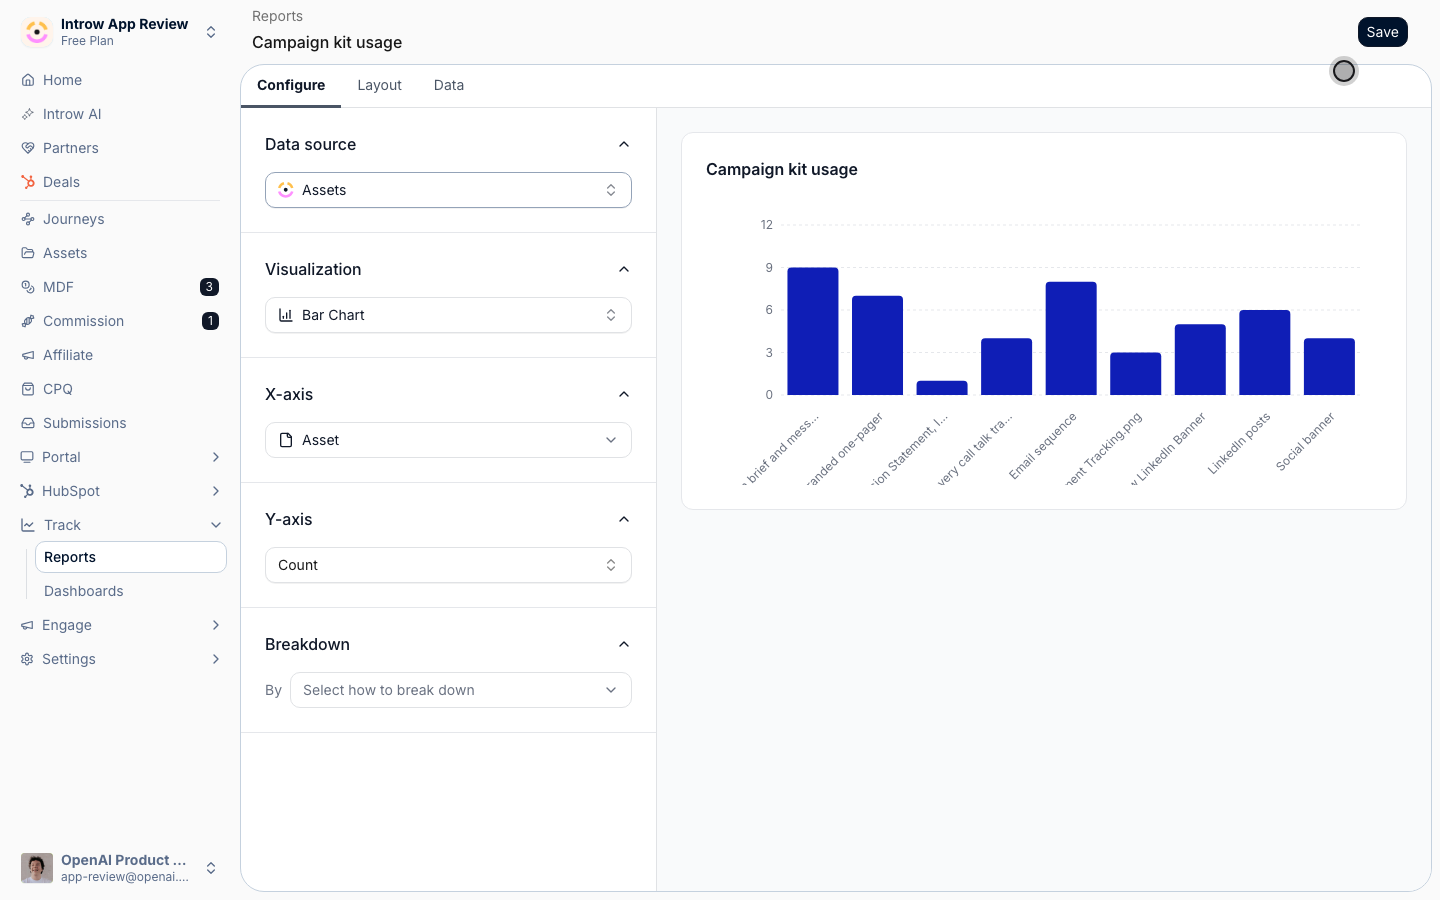
2
Compare kits
Keep Visualization on Bar chart and set the X-axis grouping to Category, so each campaign kit is one bar.
Keep the metric on Count: each bar is the number of times partners opened that kit’s assets.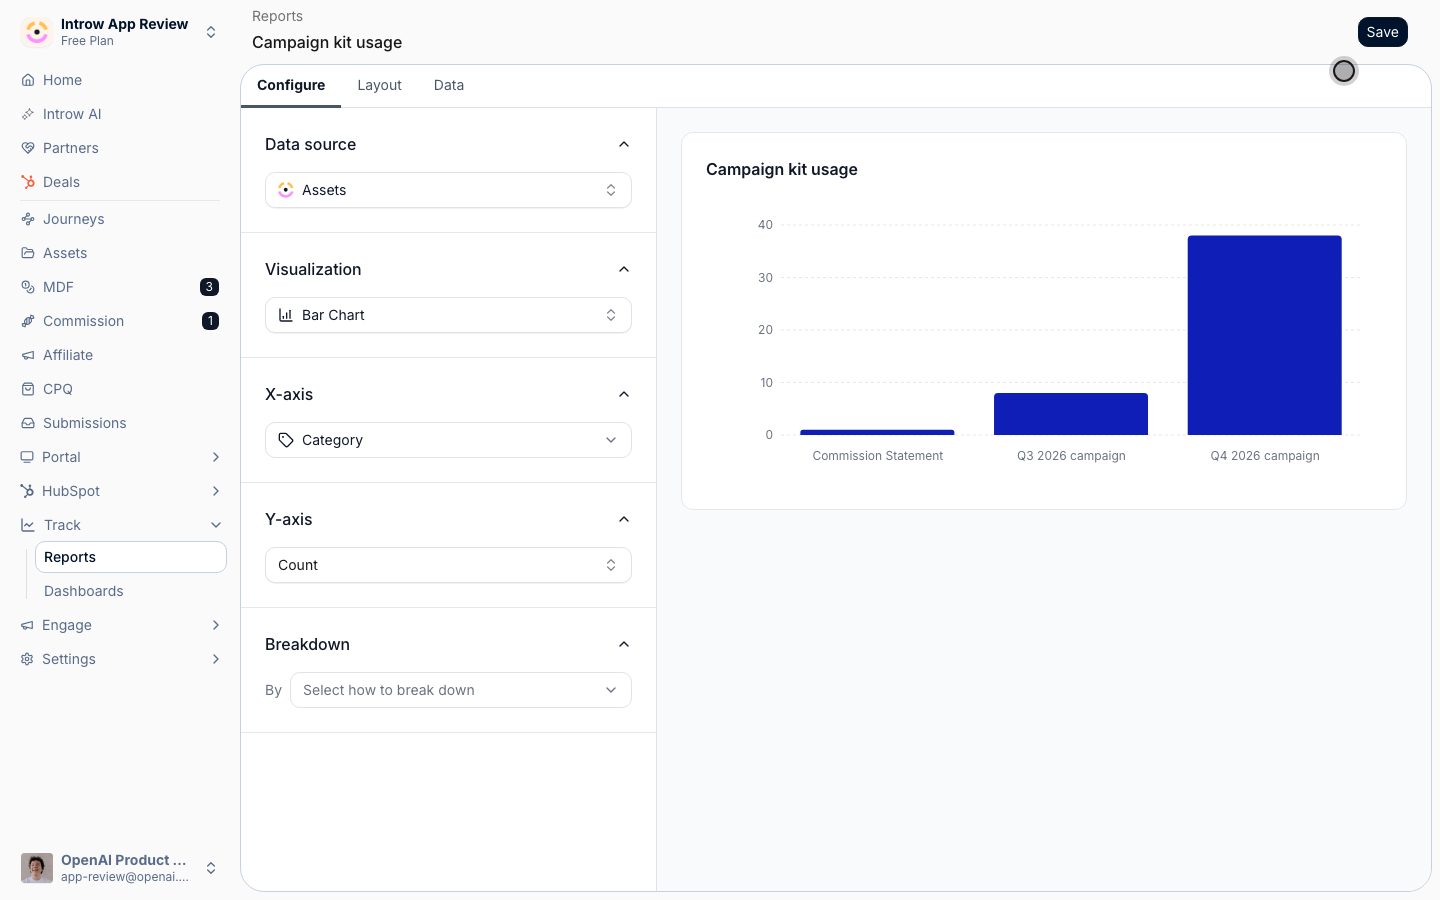
3
Split views from downloads
Set Breakdown to Downloaded and keep Stack on top of each other on.
Each bar splits into Viewed and Downloaded.
A download is the stronger signal: the partner took the asset into their own tool.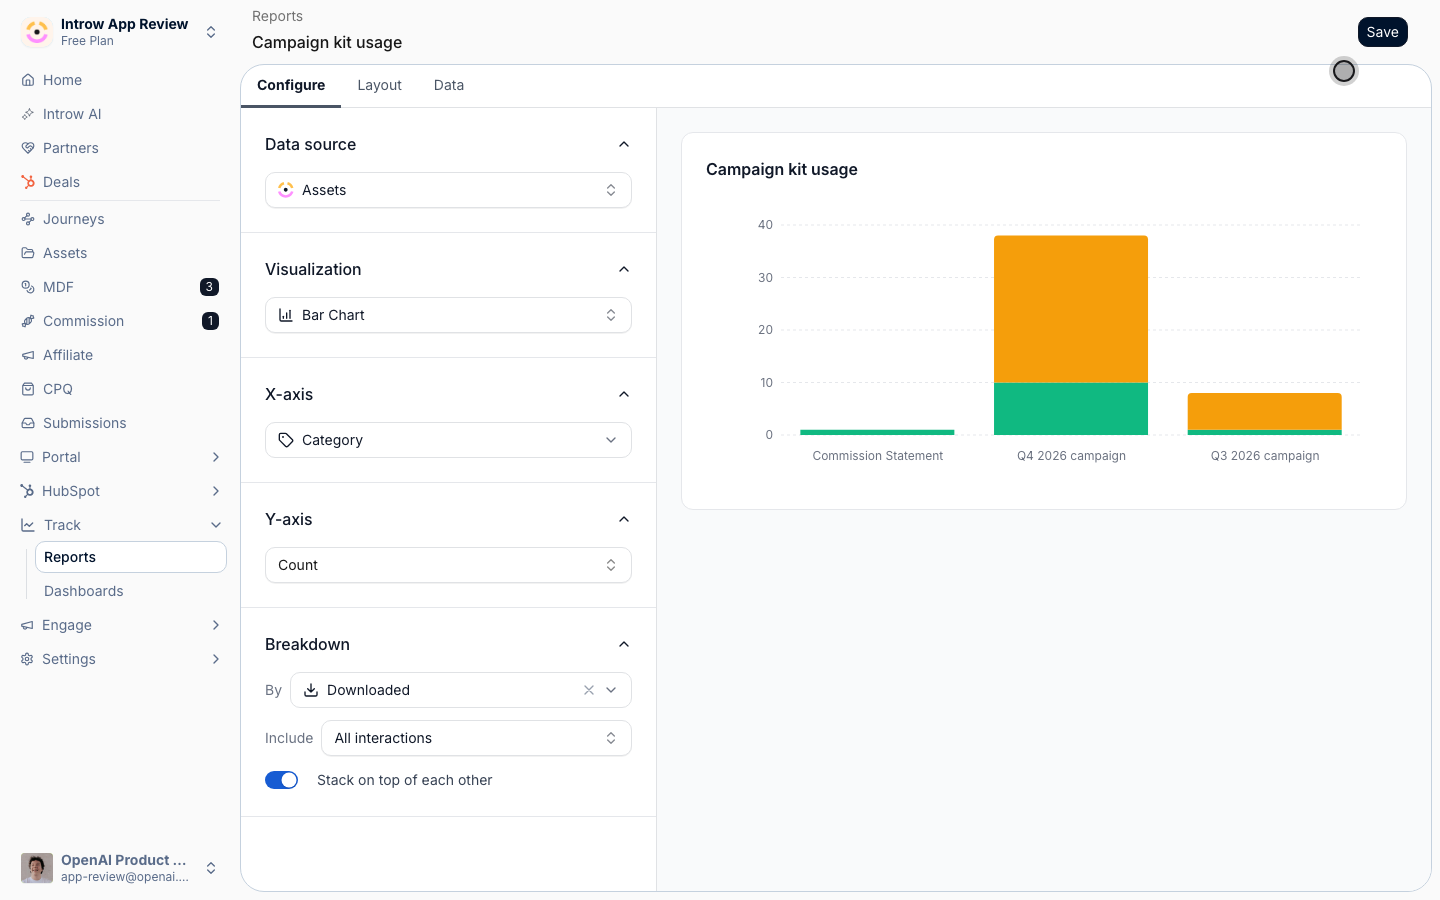
4
Scope it to the campaign period
On the Data tab, add a Date filter for the campaign’s run.
Add a Categories filter to look at one campaign, or a Partner filter to look at one partner.
Save the report.
Find who used it
1
Rank the people who opened the kit
Duplicate the report and set the X-axis grouping to Partner contact.
Under Breakdown, set Include to Viewed.
A download from a public asset link carries no contact, so counting views keeps every bar a named person.
Those at the top are the partner marketers to work the next campaign with.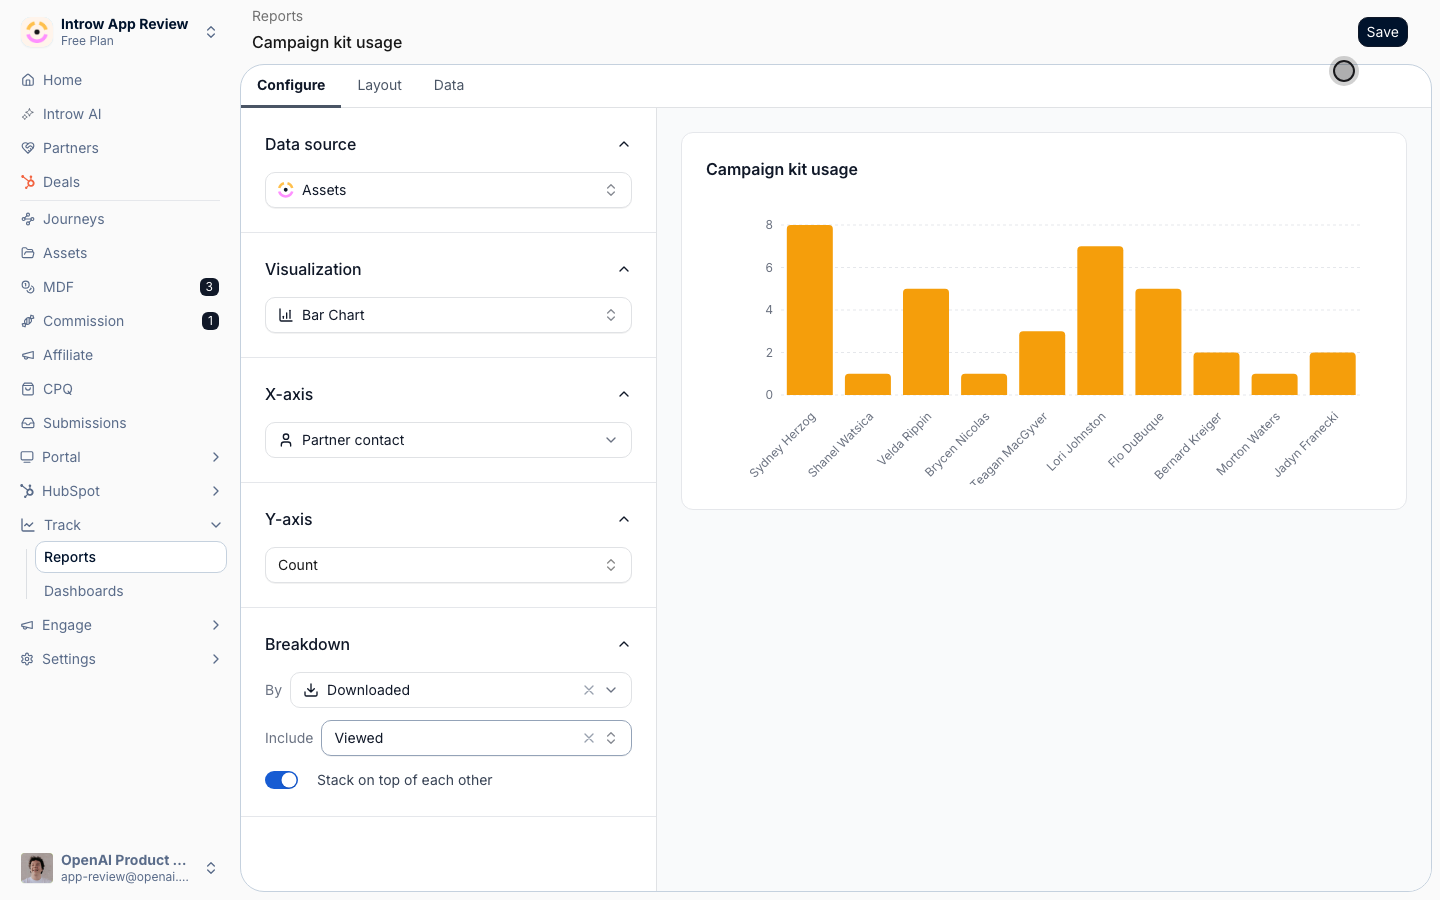
2
Compare regions or tiers
Set the X-axis grouping to a CRM property on the partner, such as Company Country/Region, or to Partner tier.
Search the grouping list to find a property by name.
Partners whose property is empty in your CRM land in Unknown.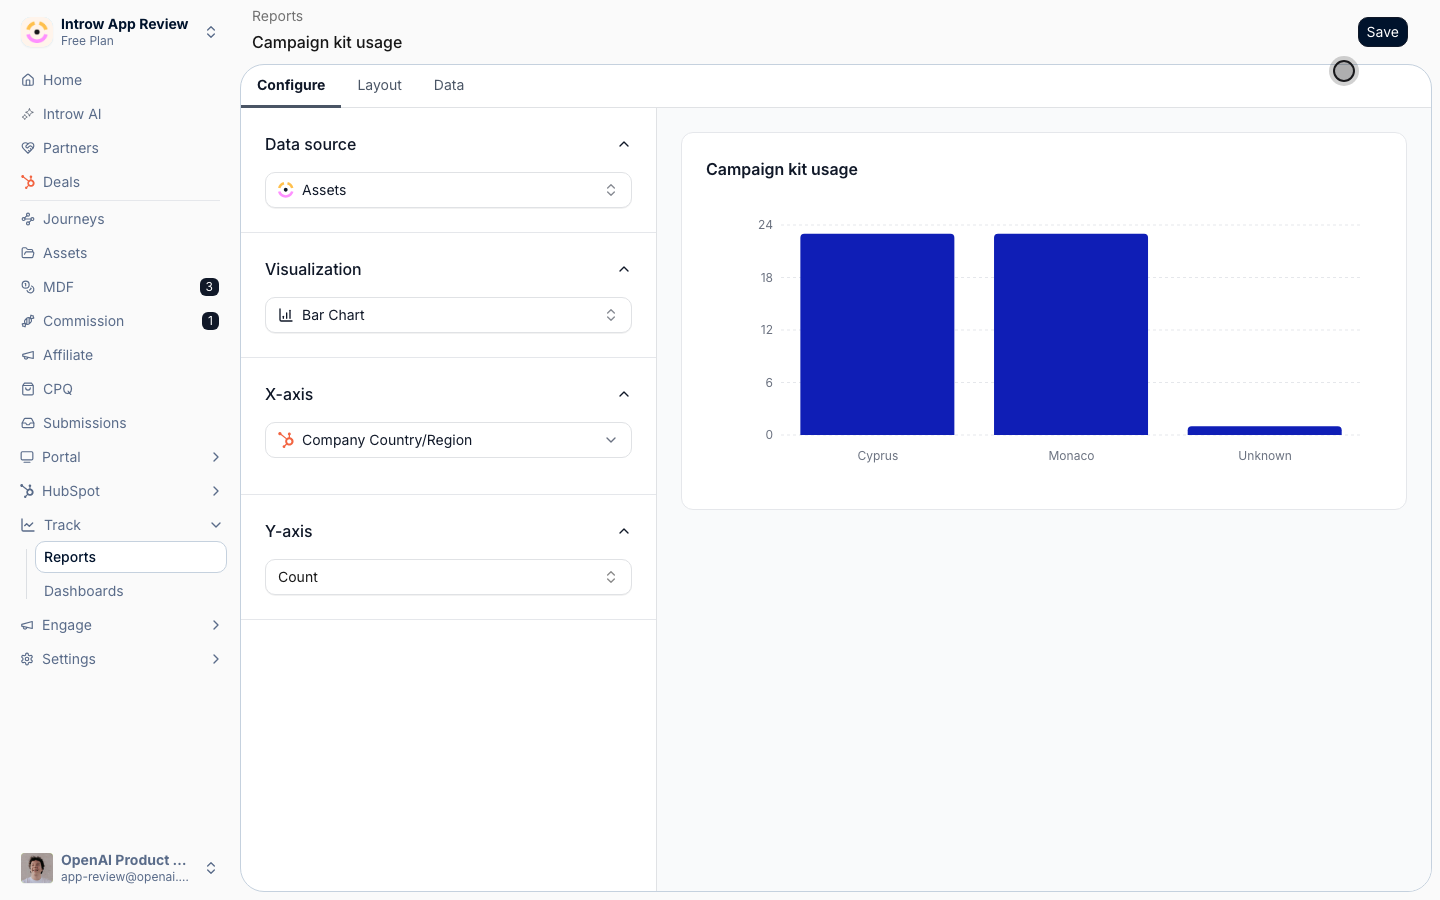
3
See which assets carry the kit
Back in Assets, open the kit’s folder and its details.
The folder shows Views for everything inside it and Total views per asset.
An asset nobody opens is the one to rewrite or drop from the next kit.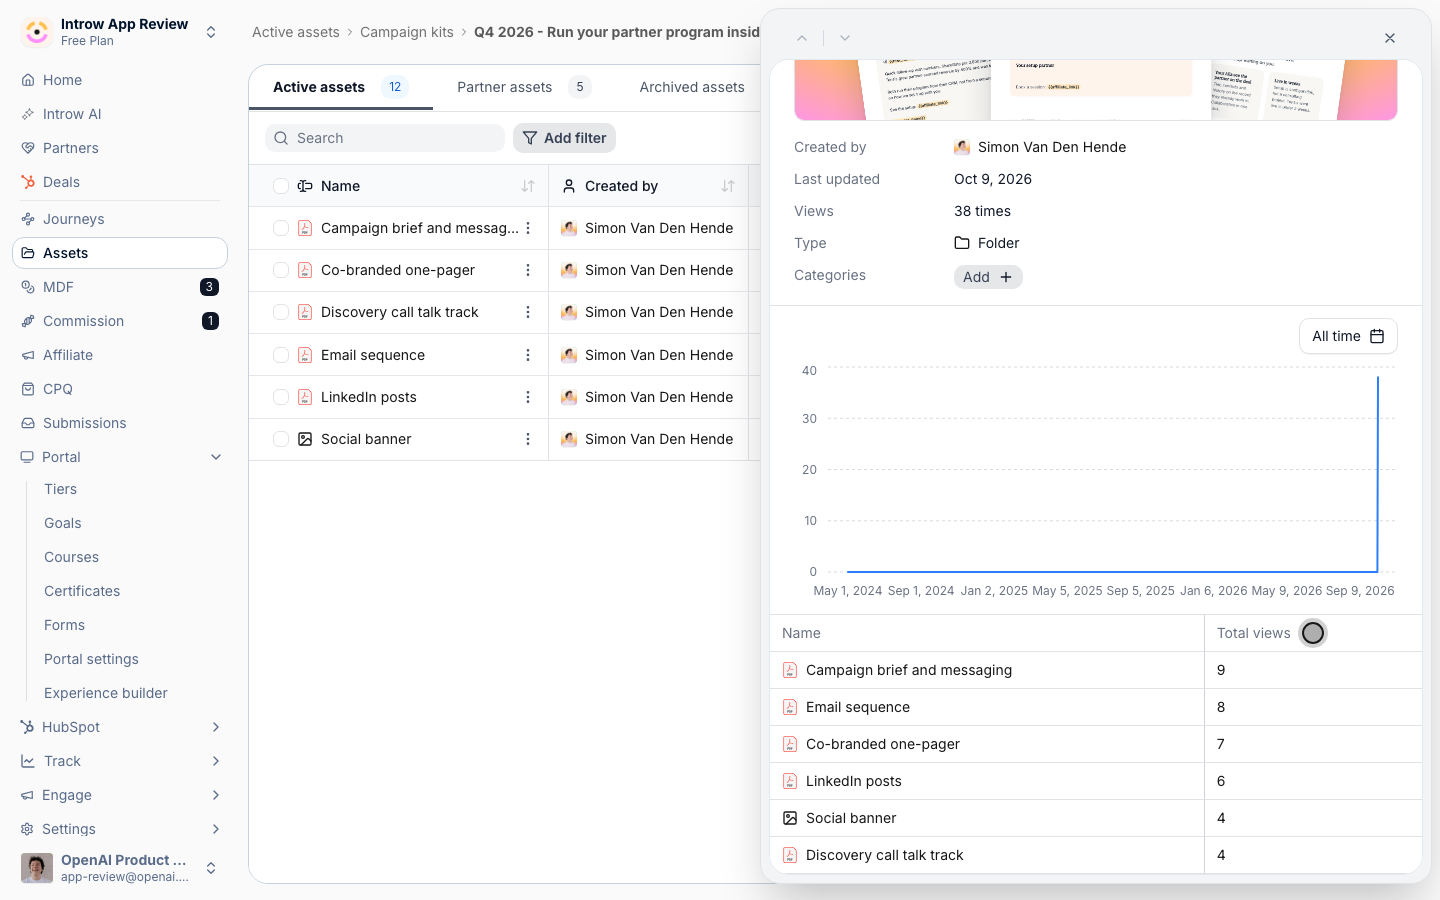
4
Check one asset in detail
Open an asset and select its Engagement tab.
Switch between People and Partners to see Last viewed and Total views per person and per partner.
Verify it worked
Open the report. You see one bar per campaign kit, split into viewed and downloaded. Grouping by Partner contact with Include set to Viewed lists the people who used it.Limits
Region and country come from a CRM company property on the partner, such as Company Country/Region. A partner with that property empty lands in Unknown, so fill it in your CRM before you compare regions. Usage tells you a partner opened or downloaded the kit, not that they sent the campaign. For what the campaign drove, see Track partner campaign attribution.What your partners experience
Nothing changes for partners. They open and download kit assets in their portal as before, and every view counts toward the report.Related
Track partner campaign attribution
See the clicks and signups each partner drove.
Review asset engagement
Every option on the Engagement tab.
Build a report
Every report builder setting in depth.
Implementation reference
Full campaign attribution configuration options.